The kgdb program is a wrapper around gdb that is used for analyzing a kernel. Unlike DDB which is integrated into the kernel and self-contained, kgdb is an external program. As a result, it requires more setup work. However, it also can target several different environments. DDB can only be used to debug the currently running kernel on the same machine and only by halting the kernel. The kgdb debugger can be used to analyze a kernel crash, inspect the currently running kernel, or debug a halted kernel on another machine. In addition, it provides a much richer debugging environment than DDB including source-level debugging, access to local symbols, and scripting that supports control flow.
In general, kgdb treats the kernel as if one were using gdb to analyze a single multi-threaded process. Each kernel thread is mapped to a single gdb thread. Thus, the usual gdb commands for managing threads (e.g. info threads and thread) can be used with kernel threads as well. One slight annoyance, however, is that the thread IDs kgdb uses have no relation to the PIDs and TIDs the FreeBSD kernel uses to identify processes and threads. Thus, to switch to a thread with a specific TID or PID one has to examine the thread list from info threads to map a TID or PID to a gdb thread ID.
To alleviate this inconvenience, kgdb provides proc and tid commands. The proc command accepts a PID and switches to the thread context of the first thread for the specified process. The tid command accepts a TID and switches to the corresponding thread. Note that the proc command does not work with remote debugging.
Kernel modules (also called ``klds'') are separate object files that can be loaded into the kernel's address space at runtime. Each kernel module contains its own symbols that are separate from the kernel's symbols. DDB uses a merged symbol table that is updated by the kernel linker when modules are loaded and unloaded. The kgdb debugger, on the other hand, has to explicitly load symbols for each kernel module from an appropriate symbol file.
An arbitrary symbol file can be loaded in kgdb using the add-symbol-file command. This command requires the relocated addresses of each section as command arguments. Doing this by hand is a bit tedious. It involves extracting the base address of the kernel module from the kernel (e.g. using kldstat(8)), and the relative addresses of each section from the kernel module (e.g. using objdump(8)). The relocated address of each section is then computed by adding its relative address to the base address of the module. Thankfully, there are ways to automate this process.
Recent versions of kgdb provide integrated support for managing kernel modules. First, the add-kld command can be used to manually load the symbols for a single module. Second, kgdb uses gdb's support for shared libraries to automatically load symbols for modules. Note that both of these features only work for a kernel with debug symbols.
The add-kld command accepts as its sole argument a pathname of a kernel module and loads the symbols for that module. The path can either be an absolute path or a relative path. If it is a relative path, then kgdb will look for the module in several directories: the current working directory, the directory of the current kernel executable, and each directory in the target kernel's module path. If a kernel module is found, then its filename is matched to one of the target kernel's loaded modules. The base address for the loaded module is read from the target kernel and used to relocate the section addresses in the kernel module symbol file. Basically, add-kld is a wrapper around the gdb command add-symbol-file that does all the math internally. As with add-symbol-file, the only way to unload symbols added via add-kld is to clear all symbols via the file or symbol-file commands.
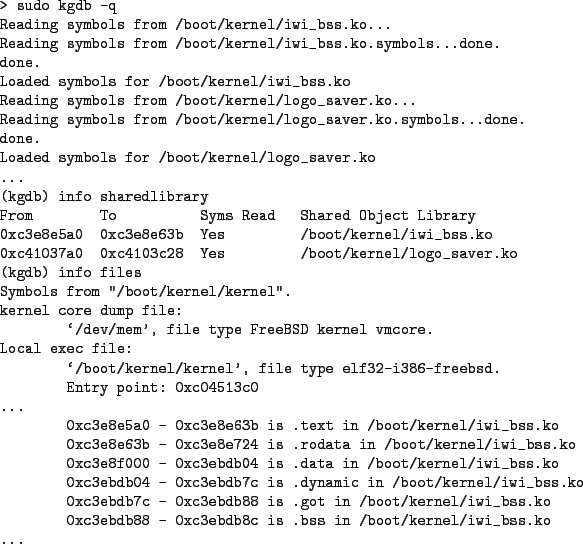
For more automated handling of kernel modules, kgdb hooks into gdb's shared library support and treats kernel modules as shared libraries. As a result, the standard commands for manipulating shared libraries in gdb such as info sharedlibrary, sharedlibrary, and nosharedlibrary can be used to manage kernel module symbols. In addition, sections from kernel modules loaded via the shared library mechanism are listed in the info files output. Figure 12 shows the kernel modules loaded on my laptop.
To locate the corresponding file for a kernel module, kgdb will first use the absolute path stored in the kernel image for 8.0 and later. Note that you can use set solib-absolute-prefix to force a prefix for the absolute paths. If the absolute path is not present (or the corresponding file is not present), then kgdb will first search for the file in paths set via set solib-search-path. If that fails, then kgdb will search the same set of paths as the add-kld command.
Using this facility, symbols for kernel modules are automatically loaded when a vmcore file is used as the target. When debugging a remote target, on the other hand, symbols for kernel modules are not automatically loaded when attaching to the target. However, invoking the info sharedlibrary command will cause kgdb to query the list of kernel modules from the remote kernel. Afterward the sharedlibrary command can be used to load symbols for the modules.
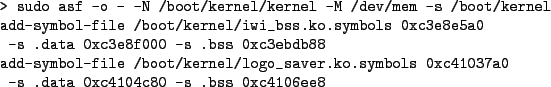
For older versions of kgdb, the asf(8) [10] tool can be used to automate the loading of kld symbols. Specifically, asf(8) searches for kernel modules corresponding to a set of loaded modules and then generates a text file containing add-symbol-file commands to load the symbols for each module. Note that by default, asf(8) expects to parse output from kldstat(8) on its standard input to obtain the list of kernel modules. However, the -M and -N options can be used to make asf(8) read the list of kernel modules directly from a vmcore similar to kgdb. Also, asf(8) assumes that it is invoked from a kernel build directory. If you wish it to load symbols from the modules in the installed location you will need to use the -s flag and specify an explicit kernel module path. Once asf(8) has generated a gdb command file, the symbols can be loaded by using the source command from kgdb to execute the commands in the generated file. Figure 13 shows the command file generated by asf(8) for the modules loaded on my laptop. Note that the addresses of the various named sections in the command for iwi_bss.ko match the addresses in the info files output from Figure 12.
Similar to DDB, kgdb can be extended by adding new commands. Rather than requiring a recompile of the kernel, new commands can be added on the fly using gdb's scripting language. GDB scripts are evaluated at runtime and are not pre-compiled. On the one hand this provides several benefits. For example, the physical layout of structures are not hardcoded into the scripts when writing them. Instead, gdb uses symbols from the kernel and modules to compute the offsets of member names as well as the addresses of global symbols. Also, gdb does not evaluate statements that are not executed. Thus, one can use members of structures that are not always present (e.g. when a new member is added) by using conditional execution. The downside is that gdb scripts require a kernel built with debug symbols for all but the simplest tasks. The gdb info documentation covers the basics of scripts, or user defined commands, but there are several quirks that are worth mentioning.
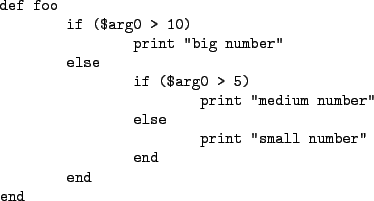
First, while gdb scripts do support control flow via while loops and if-then-else statements, there are a few limitations. For example, there is no direct ``else-if'' construct. Instead, one must include a nested if statement inside an else block. Figure 14 shows a simple example of this. In addition, there are no equivalents to the C statements break, continue, or return. There are gdb commands which have those names, but they affect the execution of the program being debugged (e.g. setting a breakpoint). Newer versions of gdb do add loop_break and loop_continue but FreeBSD's gdb does not have those commands.
Second, the implementation of arguments to user-defined commands has several subtle implications. First, there is no easy way for a command to figure out how many arguments the user passed to it. However, if the command references an argument the user did not define, then gdb will halt execution of the command with an error. Second, as described in the documentation, gdb replaces the argument variables with the text of the user-supplied argument before evaluating expressions rather than evaluating the user-supplied expression and creating a new variable with that value. This means that you cannot treat the arguments as local variables with local scope. However, it does mean that any variables passed as arguments to user-defined commands are effectively passed by reference. This provides a way to return values from user-defined commands by assigning values to argument variables.
Third, working with string literals can be awkward. Specifically, one cannot assign a string literal to a convenience variable or index a string literal unless gdb is attached to a live process, and core dumps do not count as live processes. As a result, to compare a variable in a core to a known string one has to explicitly compare invidual characters. While this is tedious, this can be useful. In Figure 15 the contents of the machine_arch global variable are used to determine the current architecture and include another command file with architecture-specific commands.
Finally, there is no way to abort execution of a user-defined command. If a user-defined command gets stuck in an infinite loop, for example, the sole recourse is to kill the kgdb process. A command can be aborted at the pager prompt if it emits a full page of output. However, one cannot use Ctrl-C or something similar to abort execution of a command.
![\begin{figure*}\begin{verbatimtab}
if (machine_arch[0] == 'a' && machine_arch[1]...
...== '8')
source gdb6.i386
set $__i386__ = 1
end
\end{verbatimtab}
\end{figure*}](img15.png)