Another debugging tool provided by the FreeBSD kernel is the in-kernel debugger DDB. DDB is an interactive debugger that allows the user to execute specific commands to inspect various details of the running kernel. It is able to resolve global symbols to addresses and control execution via breakpoints and single stepping. It is also extensible since new commands may be added at compile time. Details about several of the commonly used DDB commands may be found in the ddb(4) manpage [2].
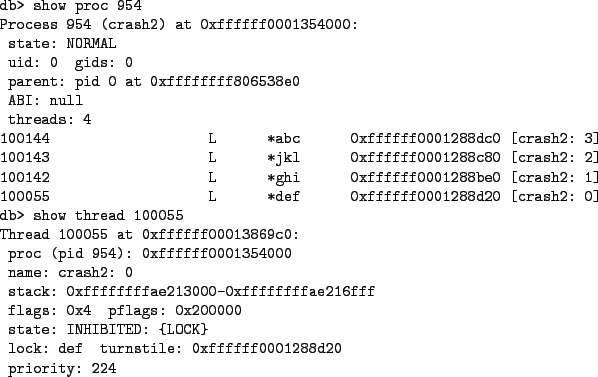
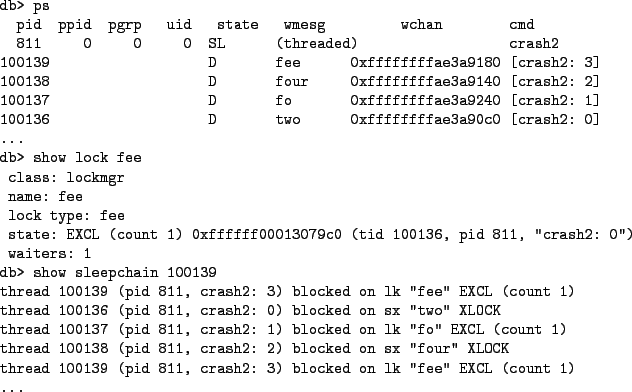
One of the best ways to get an overview of a system's state from DDB is to examine the current state of individual processes and threads. DDB provides several commands to do this. First, the ps command will display a list of all the processes and threads in the system. The listing includes a summary of the state of each thread including any lock the thread is blocked on or a wait channel on which the thread is sleeping. More specific details about individual processes may be obtained via the show proc command. This command accepts a single argument that is either a direct pointer to a struct proc or a process ID (PID). Similarly, the show thread command provides details about an individual thread and accepts either a direct pointer to a struct thread or a thread ID (TID). Figure 3 shows a truncated list of processes and threads in various states. Figure 4 shows more detailed information about the first process in the list and one of its threads.
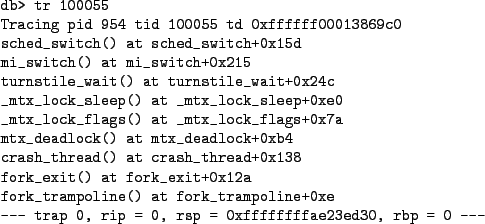
A very important part of a thread's state is the stack trace. A stack trace provides a bit of history of where the thread has been in the past. It can also help explain how a thread arrived at its current state. DDB provides a trace command to obtain the stack trace of single thread. With no aguments it will provide a trace of the current thread. If an argument is specified then it may be either a TID or a PID. If the argument is a PID, then the first thread from the indicated process will be used. Figure 5 shows the stack trace for the thread blocked on the def lock. The trace indicates that the thread attempted to acquire the lock in the aptly named mtx_deadlock function.
Debugging deadlocks requires determining which resources threads are waiting on and then analyzing those dependencies to find a cycle. One source of deadlocks is misuse of locking primitives such as mutexes. DDB provides several commands for analyzing locking primitives and the dependency relationships between threads and locks.
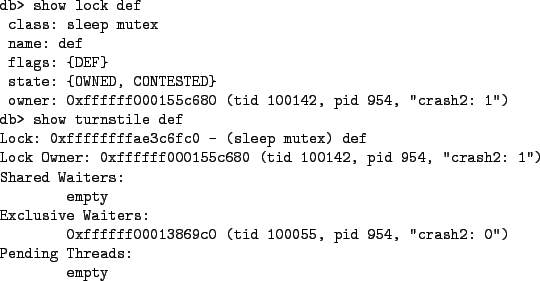
First, DDB provides commands to directly inspect the state of locks and the queues of threads waiting for locks. The show lock command takes the address of a lock (either a mutex [5], read-mostly lock [6], reader/writer lock [7], shared/exclusive (sx) lock [8], or lockmgr lock [9]) as its argument and displays details about the lock including the current owner, if any. The show turnstile command takes the address of a mutex, read-mostly lock or reader/writer wlock as its argument. If there is a turnstile associated with the lock, then it will display the lists of threads waiting on the specified lock. In Figure 3, four threads from process 954 are stuck in a deadlock cycle. In Figure 6 the relationships between the threads from that process and the def lock are inspected.
In this case, thread 100142 owns the def lock and thread 100055 is waiting for it. Note that the turnstile information actually includes the lock owners as well as the waiters for a given lock. Also, from Figure 3 one can see that the thread information includes the turnstile that a thread is currently blocked on. From this, it is apparent that one can build a dependency graph among a group of threads. For a given thread that is blocked on a turnstile, it is waiting for the owner of the lock associated with the turnstile.
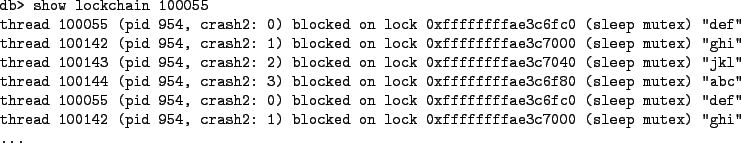
DDB provides another command, show lockchain that displays this dependency chain. It walks the thread dependencies via turnstiles until it finds a thread that is not blocked on a turnstile. If it encounters a deadlock it will stay stuck in the cycle until the user uses 'q' at DDB's -More- prompt. The show lockchain argument takes an optional argument specifying the starting thread as either a pointer to a struct thread or a TID. Figure 7 shows the dependency graph for thread 100055 which is clearly stuck in a deadlock with the other threads from the same process.
A limitation of show lockchain is that it only handles dependencies for locking primitives that use turnstiles such as mutexes. Other locking primitives such as sx locks use sleepqueues to hold threads waiting for locks. DDB includes a show sleepchain command which displays a dependency graph for threads blocked on sx locks and lockmgr locks. Figure 8 shows the dependency graph for four threads locked in a cycle of lockmgr and sx locks.
DDB commands are implemented by functions in the kernel. Thus, new commands can be added simply by writing new functions. Currently new commands cannot be added at runtime via kernel modules.
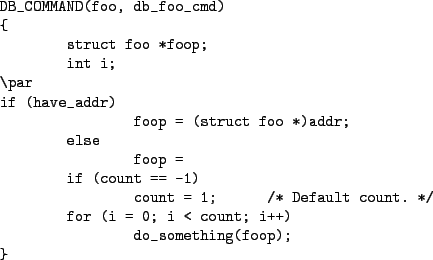
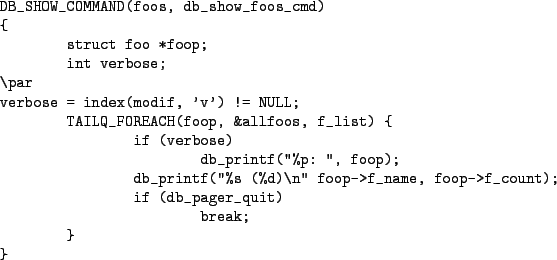
Each DDB command is bound to a function. The <ddb/ddb.h> header provides helper macros to declare a command function and add it to a command table. The DB_COMMAND macro creates a top-level command including the function prototype. See Figure 9 for an example of a simple ``foo'' command. Note that there is no explicit function prototype and that the function body immediately follows the macro. To add a ``show'' command, use DB_SHOW_COMMAND instead of DB_COMMAND.
The command function takes four arguments which provide the command's parameters. The addr argument specifies the address for the command to operate on. It may either be the user-supplied address or the dot address as described in ddb(4) [2]. The have_addr argument is a boolean that is true if the user supplied an explicit address. The count argument indicates the count of operations to be performed. If the user did not specify one, then count is set to -1. Finally, the modif argument is a string that contains the command modifiers without the leading slash. If no modifiers were specified, then modif will be an empty string.
DDB command functions are executed in an alternative environment from the rest of the kernel. One of the primary differences is that DDB uses its own I/O subsystem. DDB commands do not accept direct input from the user. Instead, the input comes from the command line when the command is invoked. Commands do output various messages to the console, and DDB provides its own API for console output.
The primary routine in DDB's I/O API is db_printf. This function takes the same arguments as printf(9) and supports all of the same output formats. This includes the extended formats %b and %D. DDB command functions should use db_printf for all console output.
An additional detail of DDB's I/O subsystem that DDB commands may need to handle is the pager. DDB's output includes a builtin pager which will interrupt the output with a -More- prompt periodically. If a command does not wish to have any of its output interrupted it may disable the pager entirely by calling db_disable_pager. The panic command does this for example. A DDB command that produces a lot of output (for example, one that iterates over a list) should honor a request by the user to abort the current command at the pager prompt. If the user aborts a command, then the global variable db_pager_quit will be set to true. Thus, DDB command functions simply need to check the state of db_pager_quit periodically and gracefully exit when it is non-zero. Figure 10 contains a sample ``show foos'' command which walks a list of struct foo objects displaying information about each object. It supports a ``v'' flag to enable more verbose output.
Another useful debugging tool DDB provides is the ability to use its symbol tables to map addresses to symbolic names. This can be very useful for looking up the name of a function for a function pointer. This is especially true when working with facilities that work on lists of function pointers such as taskqueue tasks, callouts, or SYSINITs. Note that these routines can be used outside of DDB. However, doing so may result in races with loading kernel modules, so care should be taken.
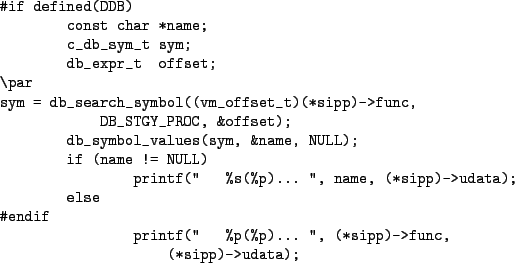
The db_search_symbol function is used to map a specific address to a symbol. It accepts an address as its first argument, a strategy as its second argument, and a pointer to a db_expr_t variable as its third argument. The strategy argument can either by DB_STGY_PROC to only match functions or DB_STGY_ANY to match any symbol. The third argument cannot be NULL as db_search_symbol assumes it always points to valid storage. Upon successful completion, the function returns a pointer to a symbol. It also stores the offset of the address relative to the symbol in the variable pointed to by the third argument. If no appropriate symbol was found, then db_search_symbol returns C_DB_SYM_NULL.
The db_symbol_values function is used to obtain the name and value of a symbol. The first argument is a pointer to a symbol (such as returned from db_search_symbol). The second argument is a pointer to a const char * and the third argument is a pointer to a db_expr_t. The second argument must point to valid storage, but the third argument can be NULL. On return from the function, the second argument will point to the name of the symbol or will have the value NULL if the first argument was an invalid symbol. The third argument will hold the value of the symbol (i.e., its address). Figure 11 shows the code from the VERBOSE_SYSINIT kernel option which outputs the name of each SYSINIT routine executed during boot.
The db_printsym routine is a wrapper around the previous two routines. It accepts an address as its first argument and a strategy as its second argument. It looks up the symbol for the address and prints the name using db_printf. If the offset of the address is non-zero, then it appends a ``+'' character followed by the offset to the output. This is the routine used by DDB's stack trace command the print the return address for each stack frame.
![\begin{figure*}\begin{verbatimtab}
db> ps
pid ppid pgrp uid state wmesg wchan c...
...CPU 2 [idle: cpu2]
100002 Run CPU 3 [idle: cpu3]
\end{verbatimtab}
\end{figure*}](img3.png)