The first debugging service the FreeBSD kernel provides is the messages the kernel prints on the console when the kernel crashes. When the kernel encounters an invalid condition (such as an assertion failure or a memory protection violation) it halts execution of the current thread and enters a ``panic'' state also known as a ``crash''. The kernel will always print a message on the console summarizing the reason for the crash. For many crashes this summary message is all the kernel outputs. Figure 1 contains the crash message for a simple assertion violation. In this case the message indicates that a thread attempted to sleep while sleeping is prohibited.
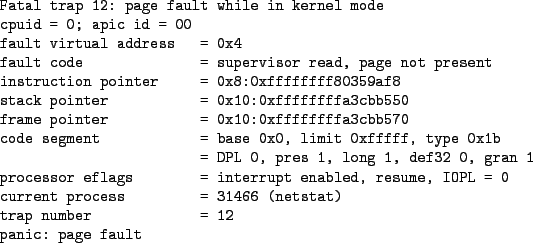
Some crashes output more detailed messages to the console. Crashes caused by a CPU exception generally output several details. For example, if a thread in the kernel dereferences a pointer into unmapped memory (such as a NULL pointer) then the crash messages will include the invalid address. Figure 2 contains the crash messages for an amd64 page fault. This particular page fault was the result of a NULL pointer dereference in the net.inet.tcp.pcblist sysctl handler. It was caused by a race condition where a struct tcpcb was freed in one thread while another thread was in the sysctl handler.
The first key piece of data is the fault virtual address. It is the invalid memory address that caused the fault. In this case the fault address is indicative of a NULL pointer derefence since its value is very small. The instruction pointer indicates the program counter value where the fault occurred. This can be used either with gdb(1) or addr2line(1) to determine the corresponding source line. The current process lists the command name and PID of the process that was executing when the fault occurred.