netperf-2.5 UDP_STREAM test was run over 3 reboot iterations, with each iteration having 1 warm up run and 10 recorded netperf runs.
On IPv6 UDP checksums are mandatory, so we did not turn them off for comparisons.
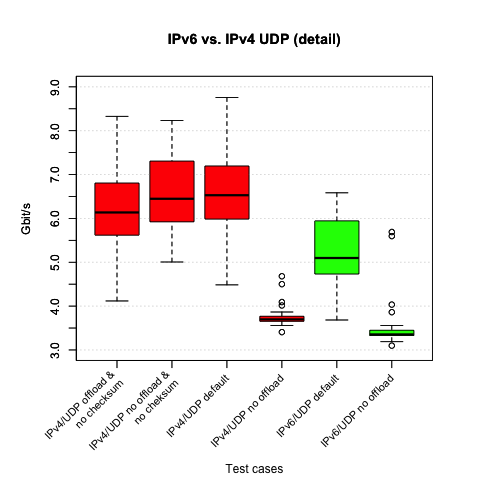
As we see the IPv4 tests with checksumming turned off still perform best. Further IPv6 UDP with "offload support" is still behind IPv4 UDP with checksumming turned on and zooming in helps us to see that we are catching up.
The range of data and in several cases the interquartile range (IQR) is still huge. There are also a significant number of outliners with UDP in the no offload cases.
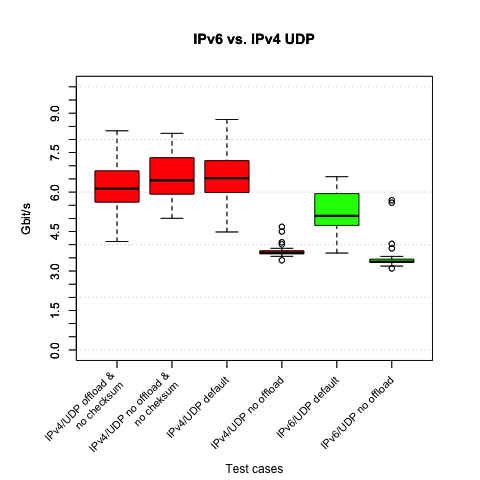
x hydra1/test_netperf_udp4_default_nocksum.stat
+ hydra1/test_netperf_udp4_nooffload_nocksum.stat
* hydra1/test_netperf_udp4_default.stat
% hydra1/test_netperf_udp4_nooffload.stat
# hydra1/test_netperf_udp6_default.stat
@ hydra1/test_netperf_udp6_nooffload.stat
+--------------------------------------------------------------------------+
|     @                                                                    |
|     @                                                                    |
|     @                                                                    |
|     @                                                                    |
|     @                                                                    |
|     @                                                                    |
|     @                                                                    |
|     @                                                                    |
|     @                                                                    |
|     @                                                                    |
|     @                                                                    |
|     @                                                                    |
|     @@ %%%             #                    *                            |
|     @@ %%%    x        #           x #      *  x      +                  |
|    @@@ @#%%   x  ##    # ##   # #  x+#** #++*+xx    * *x         +       |
|  @@@@@ @#%@ %Ox  #O  # #*OO#+*#OOO***O**##O**O*** ***+*x*  ++*x ++x*   **|
|                           |____________MA______________|                 |
|                                  |_________MA___________|                |
|                                |____________MA____________|              |
|       |_MA__|                                                            |
|                  |________MA_________|                                   |
||____M_A_______|                                                          |
+--------------------------------------------------------------------------+
    N           Min           Max        Median           Avg        Stddev
x  30       4117.36       8328.19        6137.8     6236.2927      1136.704
+  30       5005.63       8235.45       6465.39     6562.7983     931.47838
No difference proven at 95.0% confidence
*  30        4484.1       8755.31       6528.77     6582.2703     1061.2698
No difference proven at 95.0% confidence
%  30       3406.81       4680.59       3697.94     3769.4827      256.3195
Difference at 95.0% confidence
	-2466.81 +/- 425.913
	-39.5557% +/- 6.82958%
	(Student's t, pooled s = 823.953)
#  30       3683.22       6583.07       5112.01      5195.592     787.95379
Difference at 95.0% confidence
	-1040.7 +/- 505.542
	-16.6878% +/- 8.10645%
	(Student's t, pooled s = 978)
@  30       3098.59       5689.79       3355.83     3551.4927     594.82049
Difference at 95.0% confidence
	-2684.8 +/- 468.928
	-43.0512% +/- 7.51934%
	(Student's t, pooled s = 907.168)