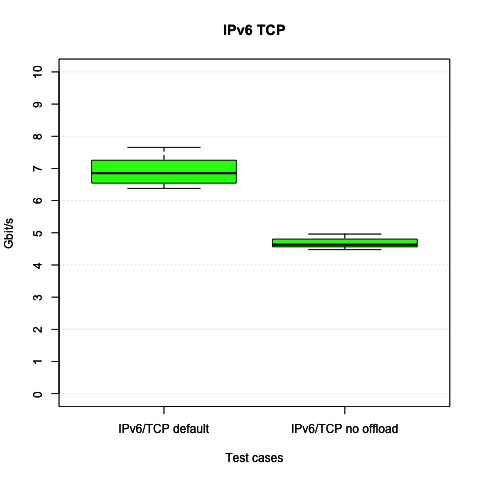
netperf-2.5 TCP_STREAM test was run over 3 reboot iterations, with each iteration having 1 warm up run and 10 recorded netperf runs.
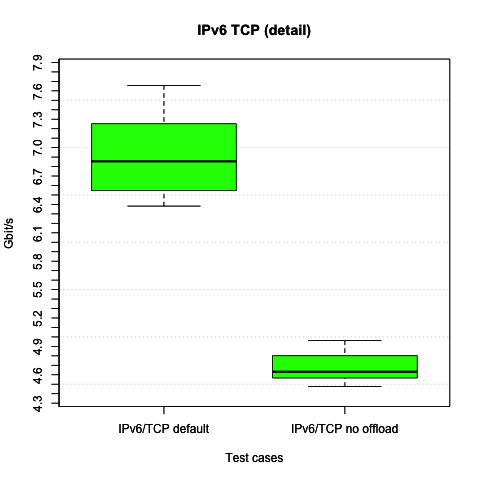
As we can see, adding support for (pretended) "checksum offloading" for IPv6 made a huge difference compared to the previous results, where the medians were basically equal.
x hydra1/test_netperf_tcp6_default.stat
+ hydra1/test_netperf_tcp6_nooffload.stat
+--------------------------------------------------------------------------+
|  +                                                                       |
|  ++                                                                      |
|  ++                                                                      |
|  +++  + +                                    x        x        x         |
| ++++ ++++                                    xxx    x x      x x         |
|++++++++++++                                xxxxxxx  xxxx   x xxxxx  x  xx|
|                                               |_______MA________|        |
|  |_MA__|                                                                 |
+--------------------------------------------------------------------------+
    N           Min           Max        Median           Avg        Stddev
x  30       6382.25       7656.47       6855.85     6913.7367     379.66968
+  30       4474.78       4960.58       4632.14     4678.9613     135.61332
Difference at 95.0% confidence
	-2234.78 +/- 147.361
	-32.3237% +/- 2.13143%
	(Student's t, pooled s = 285.079)
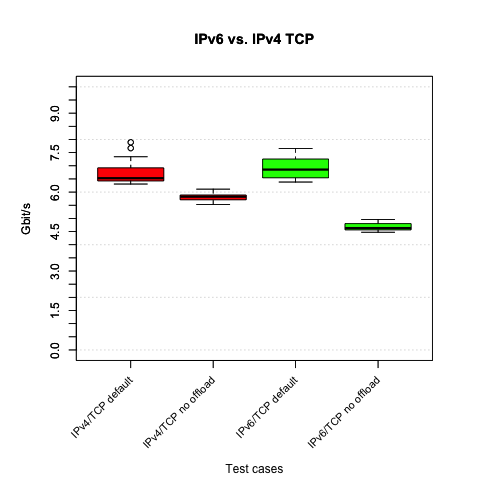
Given IPv6 "offload support" has been implemented, we added the 4th value now also distinguishing IPv6 with and without offload support..
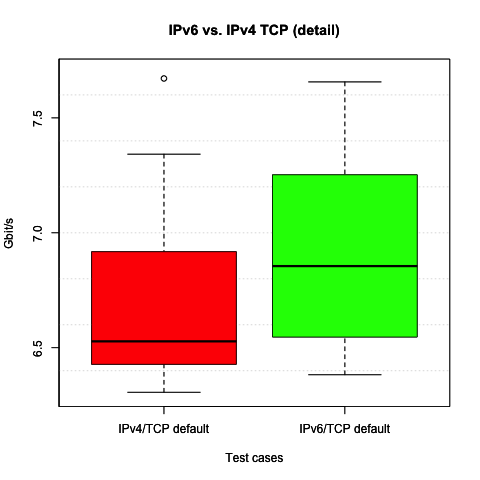
As expected IPv4 and IPv6 without offload differ to with offloading. Zooming in to our surprise we find that IPv6 with offload support is doing slightly better than IPv4 with offload support. However without offload support IPv4 is still doing a lot better.
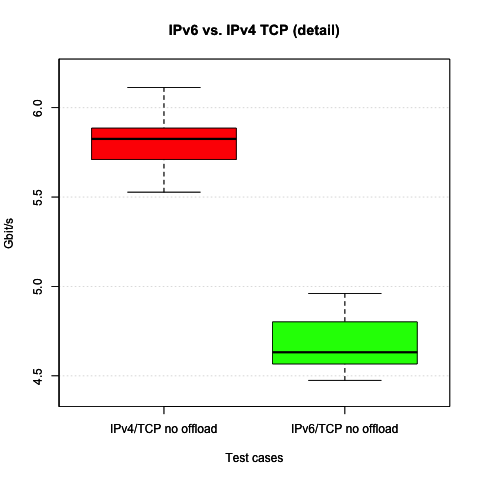
x hydra1/test_netperf_tcp6_nooffload.stat
+ hydra1/test_netperf_tcp4_nooffload.stat
* hydra1/test_netperf_tcp6_default.stat
% hydra1/test_netperf_tcp4_default.stat
+--------------------------------------------------------------------------+
|                                         %%                               |
| xxx   xx                 ++ ++          %%O*      *%       *             |
| xxxx xxx x              +++ ++ +       %%%OO *   **%     *O*%            |
|xxxxxxxxxxx           + ++++++++++ +   %%OOOOOO% O**O % * *O*O  *  *O    %|
| |_MA__|                                                                  |
|                          |_AM_|                                          |
|                                            |______MA_______|             |
|                                       |____M___A________|                |
+--------------------------------------------------------------------------+
    N           Min           Max        Median           Avg        Stddev
x  30       4474.78       4960.58       4632.14     4678.9613     135.61332
+  30       5527.42       6112.51       5834.32     5804.6183     129.32283
Difference at 95.0% confidence
	1125.66 +/- 68.4939
	24.0578% +/- 1.46387%
	(Student's t, pooled s = 132.505)
*  30       6382.25       7656.47       6855.85     6913.7367     379.66968
Difference at 95.0% confidence
	2234.78 +/- 147.361
	47.7622% +/- 3.14945%
	(Student's t, pooled s = 285.079)
%  30        6306.3       7892.74       6527.82     6729.2337     424.53354
Difference at 95.0% confidence
	2050.27 +/- 162.898
	43.819% +/- 3.48149%
	(Student's t, pooled s = 315.135)