netperf-2.5 TCP_STREAM test was run over 3 reboot iterations, with each iteration having 1 warm up run and 10 recorded netperf runs.
As we will see, contrary to the previous runs, the results now differ. The reason for this is that we started to support offloading on IPv6.
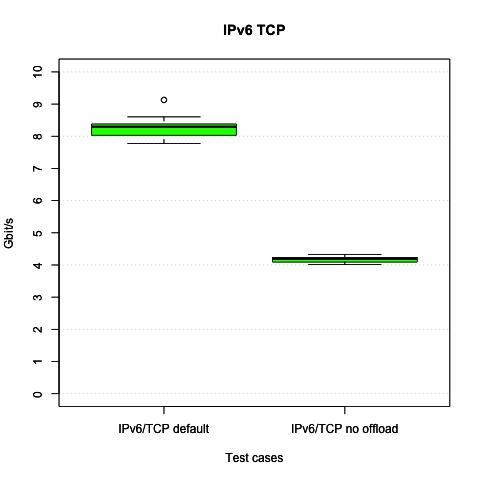
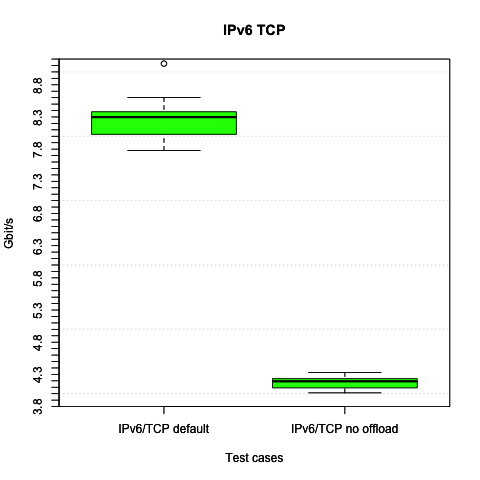
x hydra1/test_netperf_tcp6_default.stat
+ hydra1/test_netperf_tcp6_nooffload.stat
+--------------------------------------------------------------------------+
|   +                                                                      |
|   +                                                          x           |
|   +                                                          x           |
|   +                                                          x           |
| + +                                                          x           |
| + +                                                          x           |
| +++                                                          x           |
| ++++                                                         x           |
| ++++                                                  x    x x  x        |
|+++++                                                 xx x xx x  x        |
|++++++                                                xxxxxxxxxx x       x|
|                                                        |___A_M_|         |
| |AM                                                                      |
+--------------------------------------------------------------------------+
    N           Min           Max        Median           Avg        Stddev
x  30       7779.65       9129.07       8325.38     8247.0433     284.03515
+  30       4012.84       4329.77        4193.7     4172.7127     82.614191
Difference at 95.0% confidence
	-4074.33 +/- 108.121
	-49.4035% +/- 1.31103%
	(Student's t, pooled s = 209.166)
Given we have seen in the previous section, that IPv6 offload support makes a huge difference, we have added the 4th case to the following diagrams.
As expected IPv4 and IPv6 without offload support remain noticably different as already seen in the initial run.
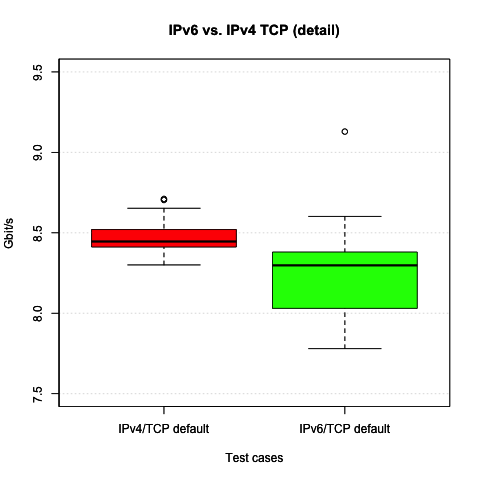
Contrary to that IPv6 with offload support is almost closing the gap to IPv4 now.
To get a better view on how far IPv6 is behind IPv4 with and without offloading, we also zoom comparing just these two cases.
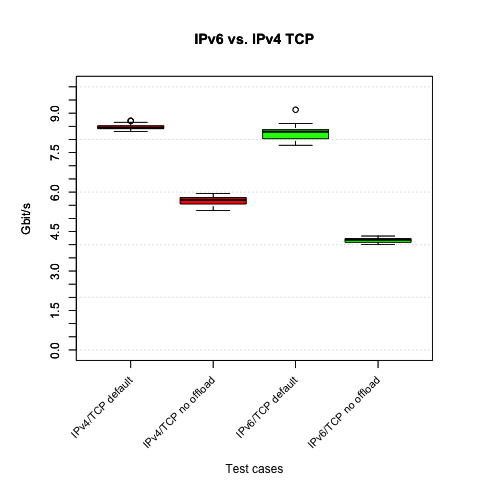
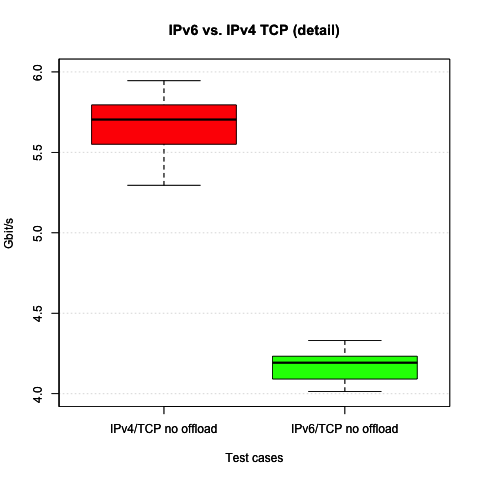
x hydra1/test_netperf_tcp6_nooffload.stat
+ hydra1/test_netperf_tcp4_nooffload.stat
* hydra1/test_netperf_tcp6_default.stat
% hydra1/test_netperf_tcp4_default.stat
+--------------------------------------------------------------------------+
|                                                               %          |
|                                                               %          |
|                                                               %          |
|                                                               %          |
|                                                               %          |
|                                                              *%          |
|                                                              *%          |
|                                                              *%          |
| x x                     +                                    *%          |
| x x                     ++                                   *%          |
| xxx                     ++                                   *%%         |
| xxxx                   +++                                   *%%         |
| xxxx                 +++++                            *    * *%%*%       |
|xxxxx               +++++++                           ** * **%*%%O%%      |
|xxxxxx            +++++++++ +                         *******OOO%O%%     *|
| |AM                                                                      |
|                     |__A_|                                               |
|                                                        |___A_M_|         |
|                                                              |MA|        |
+--------------------------------------------------------------------------+
    N           Min           Max        Median           Avg        Stddev
x  30       4012.84       4329.77        4193.7     4172.7127     82.614191
+  30       5295.53       5945.17       5728.22      5667.635     168.46945
Difference at 95.0% confidence
	1494.92 +/- 68.5833
	35.8262% +/- 1.64361%
	(Student's t, pooled s = 132.678)
*  30       7779.65       9129.07       8325.38     8247.0433     284.03515
Difference at 95.0% confidence
	4074.33 +/- 108.121
	97.6423% +/- 2.59114%
	(Student's t, pooled s = 209.166)
%  30       8300.31       8710.39       8448.19     8476.1713     104.14566
Difference at 95.0% confidence
	4303.46 +/- 48.5891
	103.133% +/- 1.16445%
	(Student's t, pooled s = 93.9985)