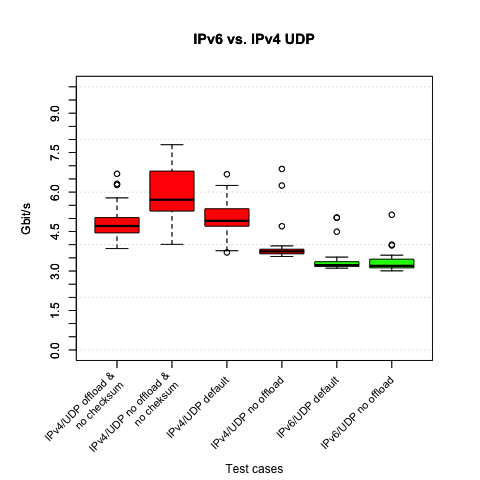
netperf-2.5 UDP_STREAM test was run over 3 reboot iterations, with each iteration having 1 warm up run and 10 recorded netperf runs.
On IPv6 UDP checksums are mandatory, so we did not turn them off for comparisons.
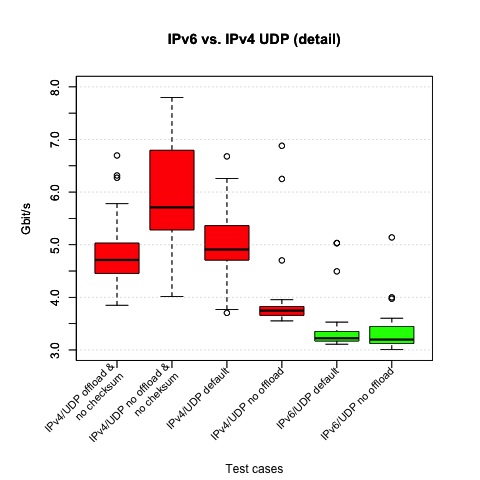
As we expect the IPv4 tests with checksumming turned off perform best. However IPv6 UDP is behind IPv4 UDP with checksumming turned on and zooming in gives us a clearer view.
As with TCP the range of data and in some cases the interquartile range (IQR) is huge. There are also a significant number of outliners with UDP.
x hydra1/test_netperf_udp4_default_nocksum.stat
+ hydra1/test_netperf_udp4_nooffload_nocksum.stat
* hydra1/test_netperf_udp4_default.stat
% hydra1/test_netperf_udp4_nooffload.stat
# hydra1/test_netperf_udp6_default.stat
@ hydra1/test_netperf_udp6_nooffload.stat
+--------------------------------------------------------------------------+
|    @                                                                     |
|    O                                                                     |
|    O                                                                     |
|   @O      %%%                                                            |
|   @O##    %%%               *                                            |
|   OO##    %%%%  +     x     *                                            |
|   OO#O  O%%%%%  +     x     *     *                                      |
|   OOOO  O%%%O% @+ x+  x xxx**xxO  *  *  ++*   +          +               |
| @@OOOO#OO@%OOO*@* x*  x#**O***xOOx*+** ++** *+++ O*    **+@    ++     +++|
|                   |_______M_A__________|                                 |
|                           |______________M_A________________|            |
|                    |_________MA__________|                               |
|     |_______M__A__________|                                              |
||____M__A______|                                                          |
||___M__A_____|                                                            |
+--------------------------------------------------------------------------+
    N           Min           Max        Median           Avg        Stddev
x  30       3849.72       6695.55       4718.12      4857.502     703.14638
+  30       4016.47          7799       5719.16     5843.6737     1151.5795
Difference at 95.0% confidence
	986.172 +/- 493.179
	20.302% +/- 10.1529%
	(Student's t, pooled s = 954.083)
*  30       3705.32       6678.58       4947.48     4976.4857     717.89929
No difference proven at 95.0% confidence
%  30       3552.05       6880.28       3749.02       3955.13     741.89795
Difference at 95.0% confidence
	-902.372 +/- 373.616
	-18.5769% +/- 7.69153%
	(Student's t, pooled s = 722.782)
#  30       3109.47       5032.19       3223.09     3416.2583     507.03191
Difference at 95.0% confidence
	-1441.24 +/- 316.86
	-29.6705% +/- 6.5231%
	(Student's t, pooled s = 612.983)
@  30       3005.88       5138.53        3201.3     3345.5933      416.3398
Difference at 95.0% confidence
	-1511.91 +/- 298.684
	-31.1252% +/- 6.14892%
	(Student's t, pooled s = 577.821)