netperf-2.5 TCP_STREAM test was run over 3 reboot iterations, with each iteration having 1 warm up run and 10 recorded netperf runs.
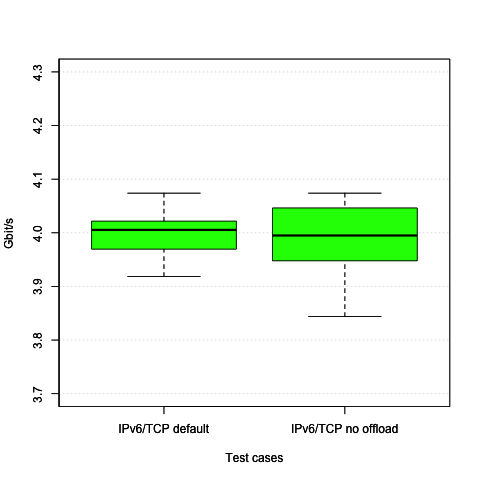
As we will see the results will not differ. The reason for this is that we do not yet support segment offloading on IPv6.
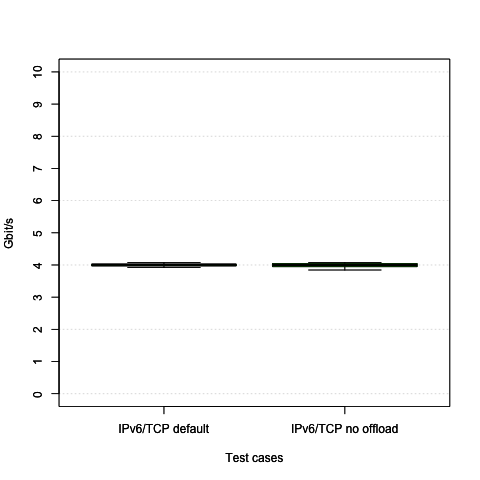
x hydra1/test_netperf_tcp6_default.stat
+ hydra1/test_netperf_tcp6_nooffload.stat
+--------------------------------------------------------------------------+
|                                x+                 xx                     |
|                                x+   +  x   x+  x  xx    + +       +  x+  |
|+       +             + xx+  +  x+  *++ * x x+ xx  *xx+*x+ + xx * ++ x*+ *|
|                                    |____________A_M__________|           |
|                            |__________________A___M______________|       |
+--------------------------------------------------------------------------+
    N           Min           Max        Median           Avg        Stddev
x  30       3918.35       4073.93        4005.6     3998.9207     41.706174
+  30       3843.73       4073.94       4003.66     3991.1483     60.129439
No difference proven at 95.0% confidence
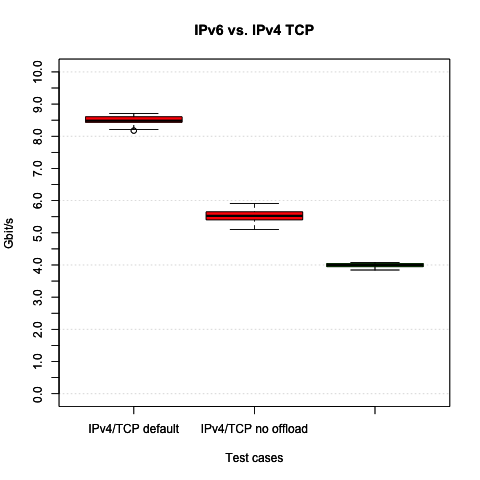
Given we have seen in the previous section, that there was no difference for IPv6 with and without offloading, we will reduce the comparison to one IPv6 case.
As expected IPv4 with offloading gives a better throughput than without offloading. IPv6 however is noticeably slower than that.
To get a better view on how far IPv6 is behind IPv4 without offloading, we also zoom comparing just these two cases.
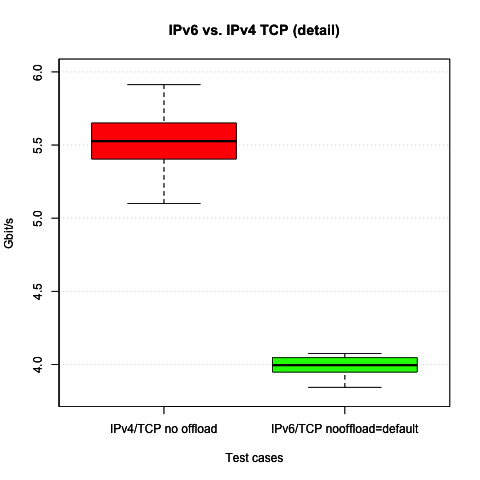
x hydra1/test_netperf_tcp6_default.stat
+ hydra1/test_netperf_tcp4_nooffload.stat
* hydra1/test_netperf_tcp4_default.stat
+--------------------------------------------------------------------------+
|                                                                     *    |
|                                                                     *    |
| xx                       +                                          *    |
| xx                     + +                                          **   |
|xxx                     + +                                          **   |
|xxx                     + ++                                         **  *|
|xxx                   + + ++                                        *** **|
|xxx                 + ++++++                                     *  ******|
|xxx               + ++++++++ ++                                  * *******|
| A|                                                                       |
|                      |__A_|                                              |
|                                                                    |_A_| |
+--------------------------------------------------------------------------+
    N           Min           Max        Median           Avg        Stddev
x  30       3918.35       4073.93        4005.6     3998.9207     41.706174
+  30        5101.2       5912.58       5532.71      5527.253     174.47967
Difference at 95.0% confidence
	1528.33 +/- 65.5713
	38.2186% +/- 1.63972%
	(Student's t, pooled s = 126.851)
*  30       8175.55       8710.61       8485.66     8498.7737     134.71652
Difference at 95.0% confidence
	4499.85 +/- 51.5464
	112.527% +/- 1.28901%
	(Student's t, pooled s = 99.7195)